Performance of ASAN Asana Inc | -12% in 12m
Compare ASAN with Indices, Sectors and Commodities ✔ like Oil, Gas, Gold, Yields and Bonds. Who outperforms?
Compare Asana Inc with its related Sector/Index XLK
Performance Duell ASAN vs XLK
| TimeFrame | ASAN | XLK |
|---|---|---|
| 1 Day | -0.87% | -0.03% |
| 1 Week | -5.25% | 3.92% |
| 1 Month | -2.95% | -1.19% |
| 3 Months | -25.3% | -1.31% |
| 6 Months | -22.3% | 17.50% |
| 12 Months | -12.0% | 37.63% |
| YTD | -16.6% | 9.43% |
| Rel. Perf. 1m | 0.18 | |
| Rel. Perf. 3m | -3.26 | |
| Rel. Perf. 6m | -4.40 | |
| Rel. Perf. 12m | -4.30 |
Is Asana Inc a good stock to buy?
Probably not. Based on ValueRay Fundamental Analyses, Asana Inc (NYSE:ASAN) is currently (May 2024)
not a good stock to buy. It has a ValueRay Fundamental Rating of -39.73 and therefor a somewhat negative outlook according to the companies health.
Based on ValueRays Analyses, Dividends and Discounted-Cash-Flow, the Fair Value of ASAN as of May 2024 is 12.14. This means that ASAN is currently overvalued and has a potential downside of -18.03% (Sold with Premium).
Based on ValueRays Analyses, Dividends and Discounted-Cash-Flow, the Fair Value of ASAN as of May 2024 is 12.14. This means that ASAN is currently overvalued and has a potential downside of -18.03% (Sold with Premium).
Is ASAN a buy, sell or hold?
- Strong Buy: 4
- Buy: 1
- Hold: 8
- Sell: 3
- Strong Sell: 2
Values above 0%: ASAN is performing better - Values below 0%: ASAN is underperforming
Compare ASAN with Broad Market Indices
| Symbol | 1w | 1m | 6m | 12m | |
|---|---|---|---|---|---|
| US S&P 500 | SPY | -8.25% | -3.11% | -43.02% | -40.42% |
| US NASDAQ 100 | QQQ | -8.56% | -2.68% | -41.89% | -50.03% |
| US Dow Jones Industrial 30 | DIA | -8.33% | -4.33% | -39.53% | -31.61% |
| German DAX 40 | DBXD | -9.58% | -6.10% | -43.65% | -28.61% |
| UK FTSE 100 | ISFU | -8.05% | -7.76% | -38.78% | -23.40% |
| Shanghai Shenzhen CSI 300 | CSI 300 | -5.21% | -7.32% | -25.72% | -0.99% |
| Hongkong Hang Seng | HSI | -6.92% | -11.26% | -25.04% | 0.40% |
| Japan Nikkei 225 | EXX7 | -4.75% | 1.67% | -34.81% | -27.54% |
| India NIFTY 50 | INDA | -2.59% | -1.33% | -39.36% | -36.59% |
| Brasil Bovespa | EWZ | -5.47% | 0.51% | -25.94% | -28.37% |
ASAN Asana Inc vs. Sectors
| Symbol | 1w | 1m | 6m | 12m | |
|---|---|---|---|---|---|
| Communication Services | XLC | -8.15% | -1.80% | -44.06% | -52.79% |
| Consumer Discretionary | XLY | -6.57% | -1.67% | -35.49% | -34.22% |
| Consumer Staples | XLP | -7.27% | -6.44% | -36.66% | -15.56% |
| Energy | XLE | -7.18% | 0.27% | -38.66% | -33.62% |
| Financial | XLF | -8.24% | -3.34% | -47.62% | -43.47% |
| Health Care | XLV | -7.26% | -2.97% | -37.35% | -22.00% |
| Industrial | XLI | -8.26% | -3.29% | -47.56% | -40.51% |
| Materials | XLB | -8.75% | -1.52% | -43.50% | -30.98% |
| Real Estate | XLRE | -8.57% | 0.24% | -35.80% | -18.06% |
| Technology | XLK | -9.17% | -1.76% | -39.76% | -49.63% |
| Utilities | XLU | -10.36% | -11.12% | -43.27% | -19.37% |
| Aerospace & Defense | XAR | -8.33% | -7.38% | -41.84% | -37.74% |
| Biotech | XBI | -5.97% | -0.05% | -55.91% | -15.59% |
| Homebuilder | XHB | -9.17% | -2.20% | -64.45% | -64.12% |
| Retail | XRT | -8.38% | -2.80% | -49.06% | -35.60% |
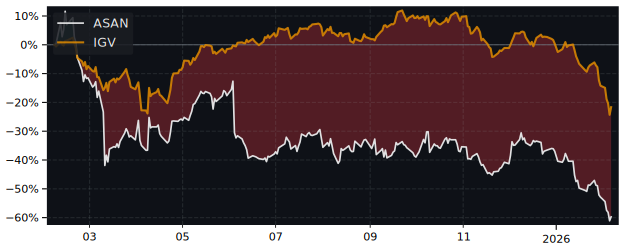
Does Asana Inc outperform its market, is ASAN a Sector Leader?
No, over the last 12 months Asana Inc (ASAN) made -12.00%, while its related Sector, the Technology Sector SPDR Fund (XLK) made 37.63%.
Over the last 3 months ASAN made -25.32%, while XLK made -1.31%.
No, over the last 12 months Asana Inc (ASAN) made -12.00%, while its related Sector, the Technology Sector SPDR Fund (XLK) made 37.63%.
Over the last 3 months ASAN made -25.32%, while XLK made -1.31%.
| Period | ASAN | XLK | S&P 500 |
|---|---|---|---|
| 1 Month | -2.95% | -1.19% | 0.16% |
| 3 Months | -25.32% | -1.31% | 4.11% |
| 12 Months | -12.00% | 37.63% | 28.42% |