SPDR Dow Jones Industrial Average T.. (DIA)
Exchange: USA Stocks • Country: USA • Currency: USD • Type: Etf • ISIN: US78467X1090 • Large Value
The SPDR Dow Jones Industrial Average ETF Trust (DIA) is an exchange-traded fund (ETF) that tracks the performance of the iconic Dow Jones Industrial Average (DJIA) index. This means that the Trust's portfolio is made up of almost all the same stocks that make up the DJIA, which is a basket of 30 of the largest and most widely traded US companies.
The Trust's holdings are weighted according to the terms of the Trust Agreement, which means that the ETF's performance is designed to closely mirror the performance of the DJIA index. This allows investors to gain exposure to the US stock market's blue-chip companies, such as Apple, Microsoft, and Johnson & Johnson, in a single investment.
The Trust is managed by State Street Global Advisors, a leading global asset manager, and is listed on the NYSE Arca exchange under the ticker symbol DIA. For more information, investors can visit the Trust's website at http://www.spdrs.com.
As a US-domiciled ETF, the Trust is subject to US regulatory oversight and is designed to provide investors with a convenient and cost-effective way to invest in the US stock market. With its diversified portfolio of high-quality stocks, the SPDR Dow Jones Industrial Average ETF Trust offers investors a way to gain broad exposure to the US equity market.
Drawdown (Underwater) Chart

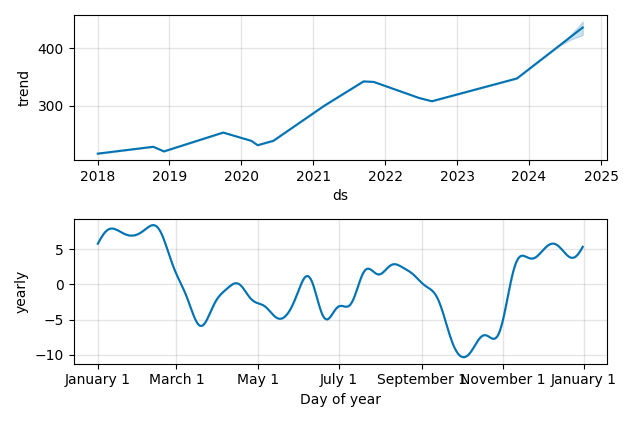
Overall Trend and Yearly Seasonality
DIA ETF Overview
| Market Cap in USD | 31,873m |
| Category | Large Value |
| TER | 0.16% |
| IPO / Inception | 1998-01-13 |
DIA ETF Ratings
| Growth 5y | 7.62 |
| Fundamental | - |
| Dividend | 6.34 |
| Rel. Performance vs Sector | -0.56 |
| Analysts | - |
| Fair Price Momentum | 392.20 USD |
| Fair Price DCF | - |
DIA Dividends
| Yield 12m | 1.54% |
| Yield on Cost 5y | 2.65% |
| Dividends CAGR 5y | 2.72% |
| Payout Consistency | 99.1% |
DIA Growth Ratios
| Growth 12m | 21.91% |
| Growth Correlation 12m | 67% |
| Growth Correlation 3m | 0% |
| CAGR 5y | 11.40% |
| CAGR/Mean DD 5y | 2.24 |
| Sharpe Ratio 12m | 1.70 |
| Alpha vs SP500 12m | -5.15 |
| Beta vs SP500 5y weekly | 0.95 |
| ValueRay RSI | 88.17 |
| Volatility GJR Garch 1y | 10.25% |
| Price / SMA 50 | 3.15% |
| Price / SMA 200 | 10.02% |
| Current Volume | 2651.8k |
| Average Volume 20d | 3502.5k |
External Links for DIA ETF
Wall Street Journal • Benzinga • Yahoo Finance
Tweets
X • Stocktwits
Fund Manager Positions
Dataroma • Stockcircle
As of May 20, 2024, the stock is trading at USD 399.95 with a total of 2,651,792 shares traded.
Over the past week, the price has changed by +1.39%, over one month by +5.46%, over three months by +4.16% and over the past year by +21.91%.
According to ValueRays Forecast Model, DIA SPDR Dow Jones Industrial Average T.. will be worth about 436.7 in May 2025. The stock is currently trading at 399.95. This means that the stock has a potential upside of +9.19%.
| Issuer | Forecast | Upside |
|---|---|---|
| Wallstreet Target Price | - | - |
| Analysts Target Price | - | - |
| ValueRay Target Price | 436.7 | 9.19 |