SPDR S&P Biotech (XBI) - Stock Price & Dividends
Exchange: USA Stocks • Country: USA • Currency: USD • Type: Etf • ISIN: US78464A8707 • Health
The SPDR S&P Biotech ETF (XBI) is an exchange-traded fund that aims to replicate the performance of the S&P Biotechnology Select Industry Index. To achieve this, the fund uses a sampling strategy, which means it selects a representative sample of securities from the index to invest in.
The fund typically invests at least 80% of its total assets in the securities that make up the index. This index, in turn, represents the biotechnology segment of the broader S&P Total Market Index (S&P TMI), which tracks the US stock market.
By investing in the SPDR S&P Biotech ETF, you'll gain exposure to a diverse range of biotechnology companies, from small-cap to large-cap, that are driving innovation and advancements in the biotech industry. This can be a great way to tap into the growth potential of this exciting and rapidly evolving sector.
The fund is listed on the NYSE Arca exchange under the ticker symbol XBI, and you can find more information about it on the SPDR website at http://www.spdrs.com.
As a US-domiciled fund, the SPDR S&P Biotech ETF is subject to US regulations and is designed to provide investors with a convenient and cost-effective way to access the biotech sector.
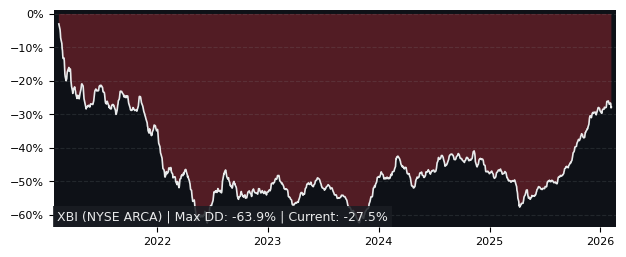
Drawdown (Underwater) Chart
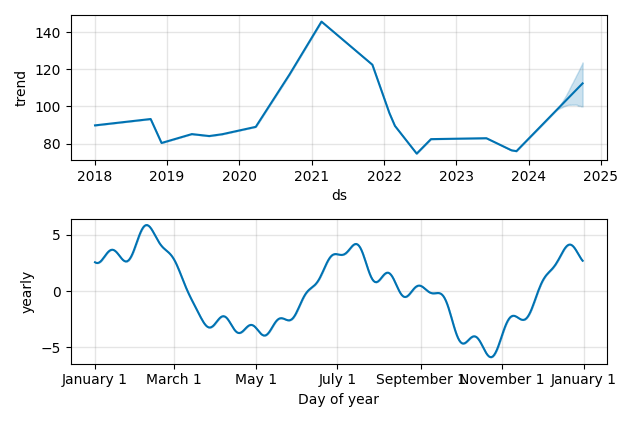
Overall Trend and Yearly Seasonality
XBI ETF Overview
| Market Cap in USD | 6,375m |
| Category | Health |
| TER | 0.35% |
| IPO / Inception | 2006-01-31 |
XBI ETF Ratings
| Growth 5y | 0.10 |
| Fundamental | - |
| Dividend | 5.08 |
| Rel. Performance vs Sector | -1.84 |
| Analysts | - |
| Fair Price Momentum | 81.58 USD |
| Fair Price DCF | - |
XBI Dividends
| Yield 12m | 0.02% |
| Yield on Cost 5y | 0.02% |
| Dividends CAGR 5y | 32.44% |
| Payout Consistency | 51.2% |
XBI Growth Ratios
| Growth 12m | 6.83% |
| Growth Correlation 12m | 25% |
| Growth Correlation 3m | -54% |
| CAGR 5y | 2.50% |
| CAGR/Mean DD 5y | 0.08 |
| Sharpe Ratio 12m | 0.06 |
| Alpha vs SP500 12m | -23.43 |
| Beta vs SP500 5y weekly | 1.08 |
| ValueRay RSI | 69.30 |
| Volatility GJR Garch 1y | 25.08% |
| Price / SMA 50 | 1.04% |
| Price / SMA 200 | 9.75% |
| Current Volume | 7247k |
| Average Volume 20d | 10368.4k |
External Links for XBI ETF
Wall Street Journal • Benzinga • Yahoo Finance
Tweets
X • Stocktwits
Fund Manager Positions
Dataroma • Stockcircle
As of May 20, 2024, the stock is trading at USD 91.18 with a total of 7,247,023 shares traded.
Over the past week, the price has changed by +1.45%, over one month by +10.08%, over three months by -1.30% and over the past year by +6.83%.
According to ValueRays Forecast Model, XBI SPDR S&P Biotech will be worth about 91.2 in May 2025. The stock is currently trading at 91.18. This means that the stock has a potential downside of -0.02%.
| Issuer | Forecast | Upside |
|---|---|---|
| Wallstreet Target Price | - | - |
| Analysts Target Price | - | - |
| ValueRay Target Price | 91.2 | -0.02 |