SPDR S&P Homebuilders (XHB) - Stock & Dividends
Exchange: USA Stocks • Country: USA • Currency: USD • Type: Etf • ISIN: US78464A8889 • Consumer Cyclical
The SPDR S&P Homebuilders ETF (XHB) is an exchange-traded fund that aims to replicate the performance of the S&P Homebuilders Select Industry Index. To achieve this, the fund uses a sampling strategy, investing at least 80% of its total assets in the securities that make up the index.
The S&P Homebuilders Select Industry Index is a subset of the S&P Total Market Index (S&P TMI), focusing specifically on the homebuilders segment. This means the fund provides exposure to companies involved in the homebuilding industry, such as construction, building materials, and related services.
As a US-domiciled fund, the SPDR S&P Homebuilders ETF is listed on the NYSE Arca exchange under the ticker symbol XHB. For more information, investors can visit the fund's website at http://www.spdrs.com.
By tracking the S&P Homebuilders Select Industry Index, the fund offers a diversified portfolio of homebuilders and related companies, allowing investors to tap into the performance of this specific industry segment.
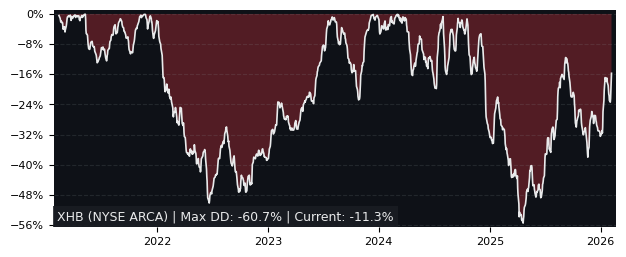
Drawdown (Underwater) Chart
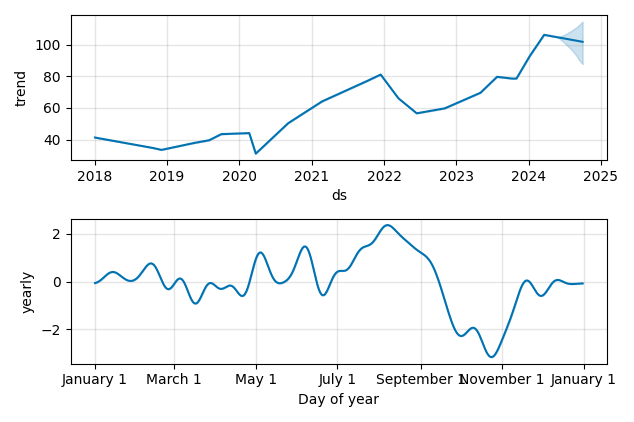
Overall Trend and Yearly Seasonality
XHB ETF Overview
| Market Cap in USD | 1,973m |
| Category | Consumer Cyclical |
| TER | 0.35% |
| IPO / Inception | 2006-01-31 |
XHB ETF Ratings
| Growth 5y | 8.36 |
| Fundamental | - |
| Dividend | 7.38 |
| Rel. Performance vs Sector | 1.55 |
| Analysts | - |
| Fair Price Momentum | 113.26 USD |
| Fair Price DCF | - |
XHB Dividends
| Yield 12m | 0.68% |
| Yield on Cost 5y | 1.91% |
| Dividends CAGR 5y | 12.77% |
| Payout Consistency | 89.4% |
XHB Growth Ratios
| Growth 12m | 50.85% |
| Growth Correlation 12m | 65% |
| Growth Correlation 3m | 19% |
| CAGR 5y | 23.03% |
| CAGR/Mean DD 5y | 2.13 |
| Sharpe Ratio 12m | 2.00 |
| Alpha vs SP500 12m | 17.59 |
| Beta vs SP500 5y weekly | 1.21 |
| ValueRay RSI | 43.51 |
| Volatility GJR Garch 1y | 20.57% |
| Price / SMA 50 | 1.23% |
| Price / SMA 200 | 18.03% |
| Current Volume | 1363.9k |
| Average Volume 20d | 2423.2k |
External Links for XHB ETF
Wall Street Journal • Benzinga • Yahoo Finance
Tweets
X • Stocktwits
Fund Manager Positions
Dataroma • Stockcircle
As of May 20, 2024, the stock is trading at USD 107.17 with a total of 1,363,933 shares traded.
Over the past week, the price has changed by +0.58%, over one month by +7.00%, over three months by +8.91% and over the past year by +50.85%.
According to ValueRays Forecast Model, XHB SPDR S&P Homebuilders will be worth about 127 in May 2025. The stock is currently trading at 107.17. This means that the stock has a potential upside of +18.48%.
| Issuer | Forecast | Upside |
|---|---|---|
| Wallstreet Target Price | - | - |
| Analysts Target Price | - | - |
| ValueRay Target Price | 127 | 18.5 |