EMCOR Group (EME) - Stock Price & Dividends
Exchange: USA Stocks • Country: United States • Currency: USD • Type: Common Stock • ISIN: US29084Q1004
EMCOR Group, Inc., listed on the NYSE as EME, specializes in electrical and mechanical construction services, operating predominantly in the United States and the United Kingdom. The company's comprehensive range of offerings includes design, installation, and maintenance services for various systems and industries.
EMCOR provides solutions related to electrical power transmission, energy systems, lighting, process instrumentation, security systems, communications, HVAC systems, fire protection, plumbing, filtration, water treatment, and more. Additionally, the company offers services like crane operations, steel fabrication, and millwright services.
Furthermore, EMCOR delivers building services for commercial and government properties, facility management, outage services, military base support, indoor air quality maintenance, landscaping, and janitorial services. They also provide technical consulting, energy system management, infrastructure projects, and industrial services for the oil and gas sectors.
Founded in 1987, EMCOR is based in Norwalk, Connecticut, with a broad spectrum of services aimed at enhancing operational efficiency and sustainability for various clients. To learn more, visit their website at https://www.emcorgroup.com.
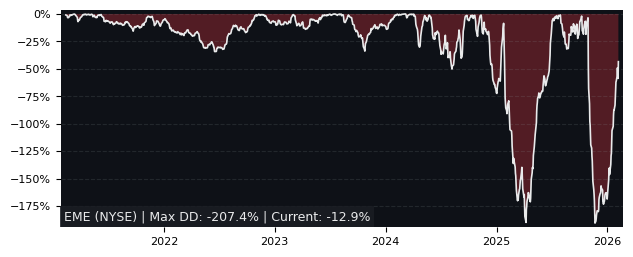
Drawdown (Underwater) Chart
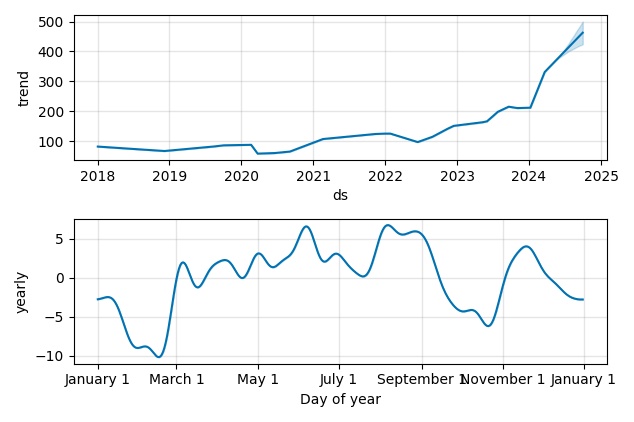
Overall Trend and Yearly Seasonality
EME Stock Overview
| Market Cap in USD | 15,950m |
| Sector | Industrials |
| Industry | Engineering & Construction |
| GiC SubIndustry | Construction & Engineering |
| TER | 0.00% |
| IPO / Inception | 1995-12-28 |
EME Stock Ratings
| Growth 5y | 8.81 |
| Fundamental | 87.8 |
| Dividend | 7.34 |
| Rel. Performance vs Sector | 5.20 |
| Analysts | 3.67/5 |
| Fair Price Momentum | 438.92 USD |
| Fair Price DCF | 605.95 USD |
EME Dividends
| Yield 12m | 0.22% |
| Yield on Cost 5y | 1.01% |
| Dividends CAGR 5y | 16.61% |
| Payout Consistency | 94.1% |
EME Growth Ratios
| Growth 12m | 107.72% |
| Growth Correlation 12m | 73% |
| Growth Correlation 3m | 76% |
| CAGR 5y | 35.05% |
| Sharpe Ratio 12m | 4.01 |
| Alpha vs SP500 12m | 83.03 |
| Beta vs SP500 5y weekly | 1.04 |
| ValueRay RSI | 65.80 |
| Volatility GJR Garch 1y | 26.78% |
| Price / SMA 50 | 8.39% |
| Price / SMA 200 | 46.33% |
| Current Volume | 609.3k |
| Average Volume 20d | 455.1k |
External Links for EME Stock
Wall Street Journal • Benzinga • Yahoo Finance
Tweets
X (Twitter) • Stocktwits
Fund Manager Positions
Dataroma • Stockcircle
As of April 27, 2024, the stock is trading at USD 354.02 with a total of 609,345 shares traded.
Over the past week, the price has changed by +7.73%, over one month by +0.88%, over three months by +58.01% and over the past year by +125.01%.
According to ValueRays Forecast Model, EME EMCOR Group will be worth about 490.4 in April 2025. The stock is currently trading at 354.02. This means that the stock has a potential upside of +38.52%.
| Issuer | Forecast | Upside |
|---|---|---|
| Wallstreet Target Price | 362.5 | 2.40 |
| Analysts Target Price | 237.5 | -32.9 |
| ValueRay Target Price | 490.4 | 38.5 |