Core & Main (CNM) - Stock Price & Dividends
Exchange: USA Stocks • Country: United States • Currency: USD • Type: Common Stock • ISIN: US21874C1027
Core & Main, Inc., listed as CNM on the New York Stock Exchange, operates in distributing essential water, wastewater, storm drainage, and fire protection products and services across the United States. The company serves municipalities, private water businesses, and professional contractors, focusing on municipal, non-residential, and residential sectors.
At Core & Main, the product range is extensive and includes pipes, valves, hydrants, fittings, and various water-related products. They also offer storm drainage solutions like piping systems, basins, manholes, and erosion control products. Additionally, their fire protection line comprises pipes, sprinkler equipment, and customization services, while their meter products feature smart solutions and installation services.
This company, founded back in 1874, specializes in providing products and services crucial for maintaining, repairing, and constructing water, wastewater, storm drainage, and fire protection infrastructure all over the country. With its headquarters in St. Louis, Missouri, Core & Main, Inc. continues to be a vital player in the industry. For more information, visit their website at https://www.coreandmain.com.
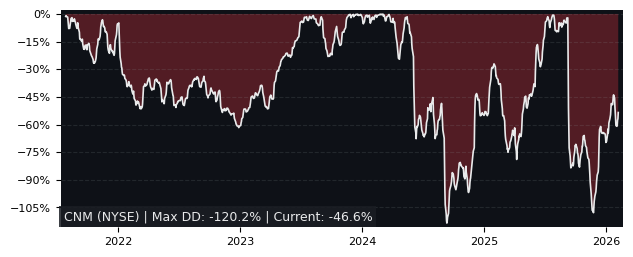
Drawdown (Underwater) Chart
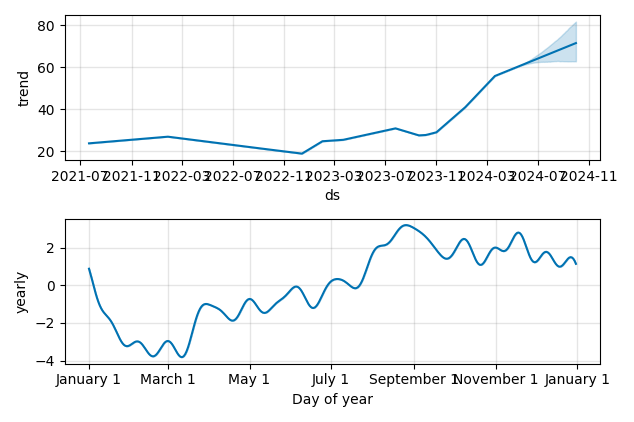
Overall Trend and Yearly Seasonality
CNM Stock Overview
| Market Cap in USD | 11,271m |
| Sector | Industrials |
| Industry | Industrial Distribution |
| GiC SubIndustry | Trading Companies & Distributors |
| TER | 0.00% |
| IPO / Inception | 2021-07-22 |
CNM Stock Ratings
| Growth 5y | 7.13 |
| Fundamental | 67.0 |
| Dividend | - |
| Rel. Performance vs Sector | 5.62 |
| Analysts | 3.80/5 |
| Fair Price Momentum | 65.67 USD |
| Fair Price DCF | 149.91 USD |
CNM Dividends
| Yield 12m | 0.00% |
| Yield on Cost 5y | 0.00% |
| Dividends CAGR 5y | 0.00% |
| Payout Consistency | 0.0% |
CNM Growth Ratios
| Growth 12m | 119.95% |
| Growth Correlation 12m | 79% |
| Growth Correlation 3m | 72% |
| CAGR 5y | 46.19% |
| Sharpe Ratio 12m | 4.29 |
| Alpha vs SP500 12m | 90.34 |
| Beta vs SP500 5y weekly | 1.30 |
| ValueRay RSI | 58.75 |
| Volatility GJR Garch 1y | 28.26% |
| Price / SMA 50 | 8.36% |
| Price / SMA 200 | 47.24% |
| Current Volume | 997.1k |
| Average Volume 20d | 1766.1k |
External Links for CNM Stock
Wall Street Journal • Benzinga • Yahoo Finance
Tweets
X (Twitter) • Stocktwits
Fund Manager Positions
Dataroma • Stockcircle
As of April 27, 2024, the stock is trading at USD 57.32 with a total of 997,116 shares traded.
Over the past week, the price has changed by +5.82%, over one month by +0.07%, over three months by +41.36% and over the past year by +127.01%.
According to ValueRays Forecast Model, CNM Core & Main will be worth about 73.1 in April 2025. The stock is currently trading at 57.32. This means that the stock has a potential upside of +27.44%.
| Issuer | Forecast | Upside |
|---|---|---|
| Wallstreet Target Price | 61 | 6.42 |
| Analysts Target Price | 37.5 | -34.6 |
| ValueRay Target Price | 73.1 | 27.4 |