Si-Bone (SIBN) - Stock Price & Dividends
Exchange: USA Stocks • Country: United States • Currency: USD • Type: Common Stock • ISIN: US8257041090
Si-Bone Inc, listed on the NASDAQ as SIBN, is a medical technology company specializing in developing innovative implantable devices to address musculoskeletal disorders of the sacropelvic anatomy globally.
The company's flagship product is the proprietary minimally invasive surgical implant system, which caters to a range of conditions such as sacroiliac joint dysfunction, adult deformity, degeneration, and pelvic trauma.
Si-Bone Inc's innovative products include the iFuse-3D titanium implant, combining a unique triangular cross-section with a 3D-printed porous surface and fenestrated design. Additionally, the iFuse-TORQ offers 3D-printed threaded implants for pelvic trauma treatment, while the iFuse Bedrock Granite implant serves as a foundational element for sacroiliac fusion and sacropelvic fixation during segmental spinal fusion.
Operational since 2008, Si-Bone Inc is headquartered in Santa Clara, California, and markets its cutting-edge products through a direct sales force, agents, and distributors. To learn more, visit their website at https://si-bone.com.
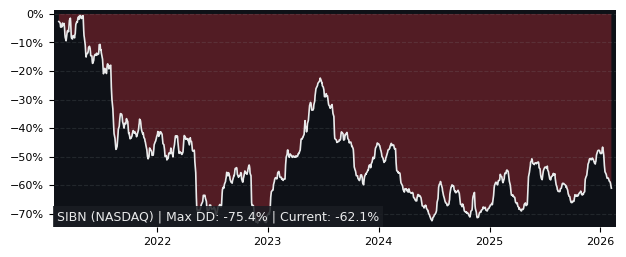
Drawdown (Underwater) Chart
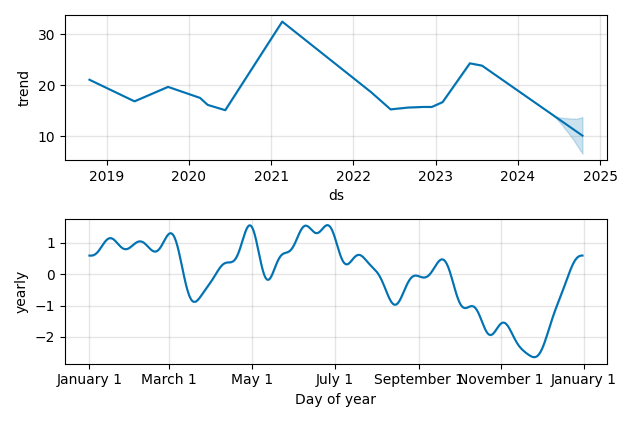
Overall Trend and Yearly Seasonality
SIBN Stock Overview
| Market Cap in USD | 586m |
| Sector | Healthcare |
| Industry | Medical Devices |
| GiC SubIndustry | Health Care Supplies |
| TER | 0.00% |
| IPO / Inception | 2018-10-17 |
SIBN Stock Ratings
| Growth 5y | -1.68 |
| Fundamental | -55.6 |
| Dividend | - |
| Rel. Performance vs Sector | -4.64 |
| Analysts | 4.56/5 |
| Fair Price Momentum | 12.43 USD |
| Fair Price DCF | - |
SIBN Dividends
| Yield 12m | 0.00% |
| Yield on Cost 5y | 0.00% |
| Dividends CAGR 5y | 0.00% |
| Payout Consistency | 0.0% |
SIBN Growth Ratios
| Growth 12m | -34.07% |
| Growth Correlation 12m | -61% |
| Growth Correlation 3m | -74% |
| CAGR 5y | -3.23% |
| Sharpe Ratio 12m | -0.90 |
| Alpha vs SP500 12m | -65.42 |
| Beta vs SP500 5y weekly | 1.39 |
| ValueRay RSI | 26.49 |
| Volatility GJR Garch 1y | 46.50% |
| Price / SMA 50 | -12.7% |
| Price / SMA 200 | -25.21% |
| Current Volume | 301.2k |
| Average Volume 20d | 336.7k |
External Links for SIBN Stock
Wall Street Journal • Benzinga • Yahoo Finance
Tweets
X (Twitter) • Stocktwits
Fund Manager Positions
Dataroma • Stockcircle
As of April 28, 2024, the stock is trading at USD 14.57 with a total of 301,183 shares traded.
Over the past week, the price has changed by -5.51%, over one month by -4.77%, over three months by -25.55% and over the past year by -33.62%.
According to ValueRays Forecast Model, SIBN Si-Bone will be worth about 14 in April 2025. The stock is currently trading at 14.57. This means that the stock has a potential downside of -4.19%.
| Issuer | Forecast | Upside |
|---|---|---|
| Wallstreet Target Price | 26.2 | 80.0 |
| Analysts Target Price | 28.4 | 94.8 |
| ValueRay Target Price | 14 | -4.19 |